In the world of tree care and specifically plant health care, timing is everything. The number of insects and pathogens waiting to attack our landscape plants is staggering. Just one species of plant can be a host to dozens of different pests, and they all work on their own schedule. Now consider all the potential pests across all of the different plants in your landscape, and it’s easy to feel like the room you’re in is beginning to spin. Luckily these landscape pests live by a very routine schedule, and that schedule is tied to heat accumulation throughout the spring, summer, and fall seasons. If we know how much accumulated heat is needed in the environment for an insect or pathogen to be active, then all we need to know is how much accumulated heat there is to accurately predict their life stage and provide good control.
So how the heck do we track something as abstract as heat accumulation? Luckily we have a tool to track how much heat is accumulated through each day usually beginning in February. In order to track heat, we use Growing Degree Days (GDD). It’s a simple calculation: we take the average temperature for the day among the maximum and minimum, divide by 2, then subtract a fixed base value and round to the nearest whole number. The base value is dependent on what pest, plant, or pathogen we’re trying to track. For most pests, we use a base 50, which is creatively labeled Growing Degree Days 50 (GDD50).
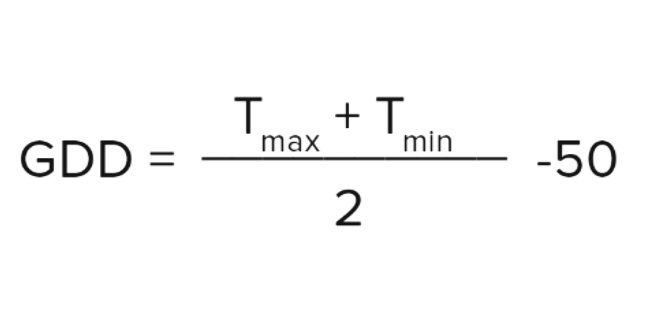
As an example:
On February 27th, 2024 at a weather tracking station in Argonne, IL, we experienced a high of 72 degrees and an overnight low of 53 degrees. For the GDD50 we take the average and subtract 50.
(72+53)/2 – 50 = 12.5
We round that 12.5 up to get 13 GDD50 for the day. Now that we have that number, we can compare it to approximate values for certain known pest lifecycle markers, or flowering/budding dates for different plants. This is how we know to prepare for applying to control pests at different times of the season when they are most vulnerable to control.
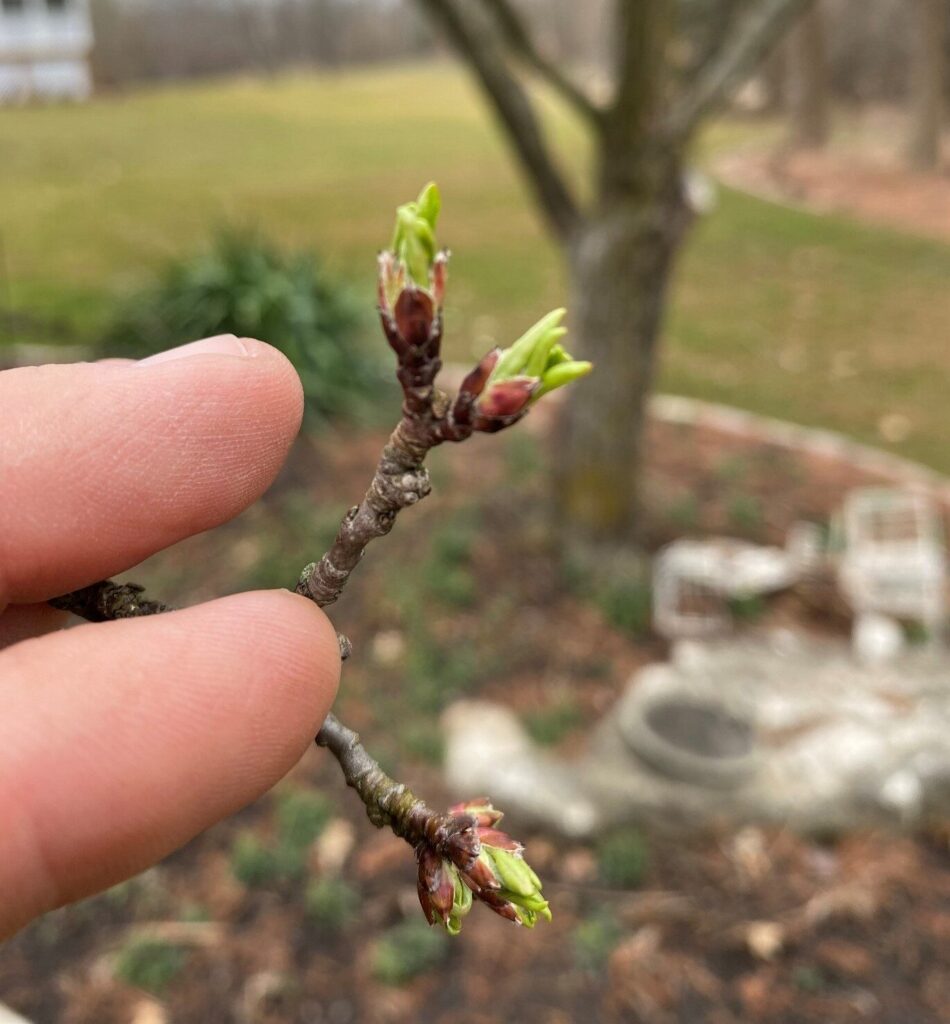
One of our services is apple scab prevention through a series of fungicide sprays. The application is highly dependent on the bud break and leaf emergence on crabapple trees. Crabapples commonly begin leafing out in early to mid-April in Illinois, but this season has been so warm that we’ve skipped ahead several weeks and we’re making applications in March whereas historically we began control in April. We can track that difference in GDD between 2023 and 2024.
Last spring, our control for apple scab began in April around 60 GDD50 accumulated heat. This spring, we surpassed 60 GDD50 accumulated heat by mid-March! This is why using a heat accumulation tracker like growing degree days is so important. If we had used a calendar schedule to track control services for pests and pathogens, those control treatments for apple scab would be applied later in the season and potentially miss the window for control.
GDDs are very useful for tracking vegetable and garden plants as well. If you’d like to keep track for yourself, Michigan State University has an excellent tracking tool available here: https://gddtracker.msu.edu/. You can even sign up for email alerts and they will automatically send you a notification email at certain thresholds.
If you have a disease problem on one of your landscape trees or shrubs that needs treatment, our plant health care team can diagnose, track, and treat it to keep your plant as healthy as possible.
We hope you enjoyed this dive into the technical aspect of tracking landscape pests and gained a little insight into how we manage to keep control on disease problems despite constant shifting weather and climate patterns.